

Introduction:
Hey there, fellow Python enthusiasts! 🐍 Ready to take your data manipulation skills to the next level? You’ve come to the right place! In this comprehensive guide, we’re delving deep into the world of DataFrames in Pandas—your ultimate toolkit for data analysis and manipulation.
What is Pandas?
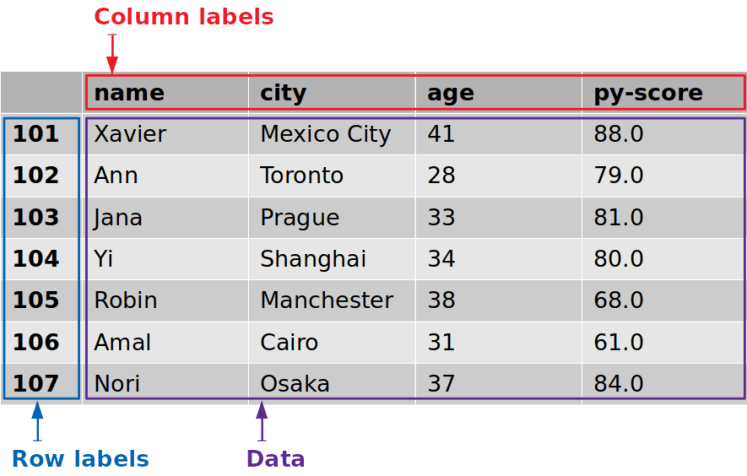
Pandas is an open-source Python library that packs a punch when it comes to handling and analyzing structured data. At the heart of Pandas lie DataFrame, two-dimensional labeled data structures that are incredibly versatile. Whether you’re dealing with spreadsheets, CSV files, or SQL-like data, Pandas’ DataFrame are your go-to solution.
Why DataFrames Matter:
Before we plunge into the tutorial, let’s understand why DataFrames are indispensable:
- Tabular Data Handling: Data in the real world often comes in tables. DataFrames mimic this structure, making it intuitive to work with structured data.
- Mixed Data Types: In a single DataFrame, you can have columns with integers, floats, strings, and more. Pandas handles this diversity effortlessly.
- Indexing Magic: DataFrames use indexes to label rows, simplifying data selection, filtering, and manipulation.
- Data Alignment: Operations between DataFrames automatically align on the index and column labels, minimizing errors.
- Comprehensive Functionality: Pandas offers a vast array of functions for data cleaning, exploration, transformation, and visualization—all designed for DataFrames.
Now, let’s roll up our sleeves and dive into the magic of DataFrames with hands-on examples.
Getting Started with DataFrames:
Example 1: Creating a DataFrame from Scratch
import pandas as pd

# Creating a DataFrame from scratch
data = {'Name': ['Alice', 'Bob', 'Charlie'],
        'Age': [25, 30, 35]}

df = pd.DataFrame(data)
print(df)
Explanation: In this example, we build a DataFrame from scratch using a Python dictionary. Each key-value pair becomes a column in the DataFrame.
Example 2: Reading Data into a DataFrame
import pandas as pd

# Reading data from a CSV file into a DataFrame
df = pd.read_csv('data.csv')
print(df.head())
Explanation: Data often resides in files like CSVs. Pandas simplifies the process of reading data into a DataFrame, which becomes your canvas for analysis.
Example 3: Accessing Columns in a DataFrame
import pandas as pd

# Accessing a specific column
data = {'Name': ['Alice', 'Bob', 'Charlie'],
        'Age': [25, 30, 35]}
names = df['Name']
print(names)
Explanation: You can access specific columns in a DataFrame as Series, which act like supercharged Python lists. In this example, we access the ‘Name’ column.
Example 4: Filtering Data in a DataFrame
import pandas as pd

# Filtering data based on a condition
youngsters = df[df['Age'] < 30]
print(youngsters)
Explanation: Filtering allows you to extract specific rows based on conditions. Here, we filter for individuals younger than 30.

Advanced DataFrame Techniques:
Example 5: Merging DataFrames
import pandas as pd

# Merging two DataFrames
merged_data = pd.merge(df1, df2, on='key_column')
print(merged_data)
Explanation: In the real world, data often comes from various sources. Pandas’ merge() function helps you combine DataFrames based on a common key column.

Example 6: Data Pivot
import pandas as pd

# Creating a pivot table
pivot_table = df.pivot_table(index='Category', columns='Month', values='Sales', aggfunc='sum')
print(pivot_table)
Explanation: Pivot tables are invaluable for reshaping data. In this example, we create a pivot table to summarize sales data by category and month.

Example 7: Grouping and Aggregating Data
import pandas as pd

# Grouping data and calculating the mean
grouped_data = df.groupby('Category')['Sales'].mean()
print(grouped_data)
Explanation: Grouping and aggregating data is crucial for summarizing information. Here, we group data by a ‘Category’ column and calculate the mean of the ‘Sales’ column for each category.
Example 8: Handling Missing Data
import pandas as pd

# Handling missing data by filling with the mean
df['column_name'].fillna(df['column_name'].mean(), inplace=True)
print(df.head())
Explanation: Missing data can be problematic. Pandas’ fillna() method allows you to handle missing values gracefully. In this example, we fill missing values in a specific column with the mean value of that column.
Example 9: Creating New Columns
import pandas as pd

# Creating a new column based on existing data
df['Total'] = df['Quantity'] * df['Price']
print(df.head())
Explanation: Data manipulation often involves creating new columns. Here, we calculate the ‘Total’ column by multiplying ‘Quantity’ and ‘Price’.
Example 10: Data Reshaping
import pandas as pd

# Unstacking a multi-index DataFrame
unstacked_data = df.unstack()
print(unstacked_data)
Explanation: Data reshaping can be necessary for specific analysis or visualization tasks. In this example, we unstack a multi-index DataFrame.
Conclusion:
You’ve just scratched the surface of what DataFrames in Pandas can do. 🚀 With DataFrames in your arsenal, you can efficiently handle structured data, perform data analysis, and transform data for various purposes.
As you continue your Python journey, don’t forget to explore Pandas’ extensive documentation, experiment with your datasets, and embrace the world of data analysis.
With DataFrames and Pandas by your side, you’re well on your way to becoming a Python pro. Happy data wrangling!
Also, check out our other playlist Rasa Chatbot, Internet of things, Docker, Python Programming, MQTT, Tech News, ESP-IDF etc.
Become a member of our social family on youtube here.
Stay tuned and Happy Learning. ✌🏻😃
Happy tinkering! ❤️🔥


